When configuring MongoDB for a microservices architecture, a single slow collection can crash the entire system. This incident illustrates how MongoDB replication lag, combined with write concern w: "majority", can weaponize a localized bottleneck to take down a 30-microservice platform running on Kubernetes—even freezing background jobs that never interact with the slow collection.
The Architecture
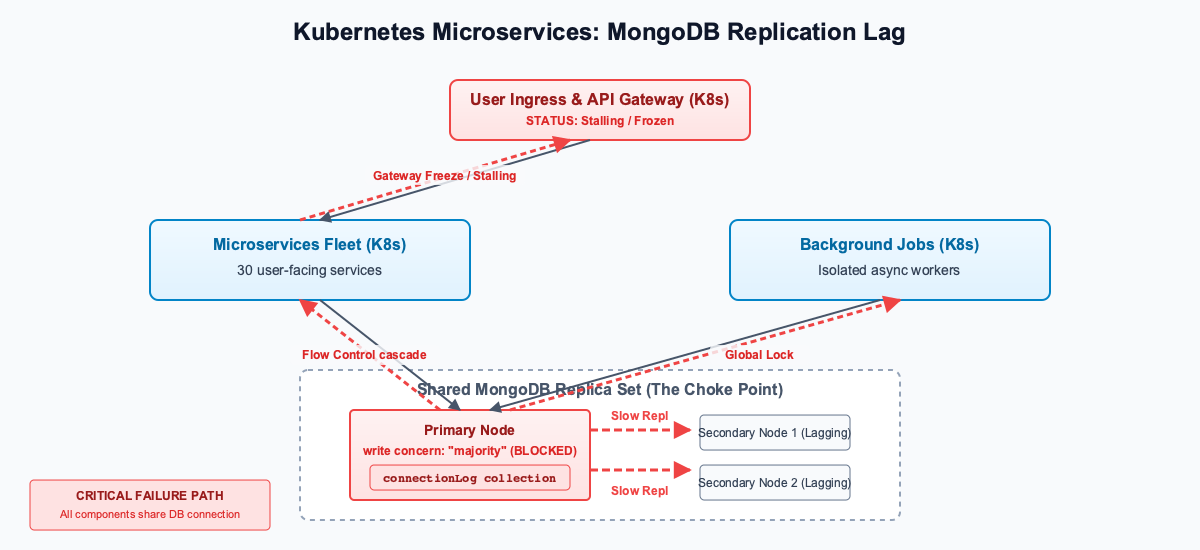
A client recently experienced a complete system freeze across their architecture. The entire platform runs on a Kubernetes cluster in GCP, backed by a single, shared MongoDB replica set for all 30 microservices.
Users could not load anything. The API gateway was taking over 3 seconds to process requests that usually took milliseconds. As part of the request flow, the gateway synchronously logged every incoming connection to a MongoDB collection (connectionLog) before routing the request to the target microservice.
When we investigated, the root cause wasn’t the network, CPU, or exhausted connection pools.
How to check MongoDB Flow Control for Replication Lag
We started by checking the primary node’s Flow Control status. MongoDB throttles the primary if secondary nodes fall too far behind (the default threshold is 10 seconds).
db.serverStatus().flowControl
Output:
 targetRateLimit: 13365
 timeAcquiringMicros: Long('3113000')
The database was actively choking itself. It dropped its target rate limit to 13,365 operations and forced incoming writes to wait for 3.1 seconds (3,113,000 microseconds) to allow secondaries to catch up.
We confirmed the lag using rs.status(). The secondaries were actively 5 to 6 seconds behind the primary’s optimeDate.
Finding the Bottleneck: A Slow MongoDB Collection
The secondaries were simply too slow to write to the connectionLog collection. The volume of incoming traffic to the gateway wasn’t the issue—traffic was actually quite normal. However, every request triggered an update to a specific document structure in this collection that had grown massive over time, causing those specific updates to replicate painfully slowly.
But the data structure itself isn’t the point of this story. The real issue is how a localized slowness—even under normal traffic—brought down the entire system by causing MongoDB replication lag.
As the secondaries took longer and longer to process these slow updates, the replication lag quietly climbed to 5 seconds.
The w: "majority" Cascade: Global MongoDB Latency
This is where the system completely broke down.
The application was configured to use write concern: "majority". This means the primary will not acknowledge a write until the secondary nodes have written the operation to their local oplogs.
Because the secondaries were bogged down processing connectionLog inserts, they could not acknowledge any new writes quickly.
This did not just delay the gateway’s logging. It created a global cluster bottleneck. Because of the replication lag and the w: "majority" requirement, every single microservice trying to write to any collection in that MongoDB cluster was hit with extreme latency.
Even isolated backend, asynchronous background jobs—processes that never interact with the gateway—were suddenly taking seconds to complete simple database inserts.
Flow Control compounded this by adding a blanket 3.1-second wait time (timeAcquiringMicros) to all writes to prevent the secondaries from falling off the oplog entirely.
The cascade was total:
1. The gateway made normal, routine logging updates to the slow connectionLog collection.
2. Because of the collection’s structure, the secondaries took too long to replicate those updates, creating a 5-second replication lag.
3. Because of w: "majority", the primary blocked, waiting for the lagging secondaries to acknowledge.
4. All writes across all 30 microservices—including isolated backend processes—became extremely slow.
5. The gateway, waiting for its synchronous log writes to complete, stalled all incoming user traffic.
Fixing the Replication Lag
To immediately relieve the pressure and clear the replication lag, we dropped the collection using db.connectionLog.drop(). The buffer cleared, the secondaries caught up, Flow Control disengaged, and the 3-second database latency disappeared across the entire platform.
The long-term fix was simply to restructure the logging collection to avoid appending to an ever-growing array. But this incident serves as a stark reminder: when configuring MongoDB, especially when using write concern: "majority", a single slow collection can create replication lag that bottlenecks your entire database, freezing applications and background processes that don’t even know that collection exists.
Reclaim your proprietary data. Deploy Private AI.
Stop sending your proprietary IP to external APIs and managed SaaS. We deploy high-throughput inference and stateful agents directly onto your own Bare-Metal or VPC infrastructure. Execute AI workloads with zero API taxes, zero hyperscaler lock-in, and absolute control over your data.